


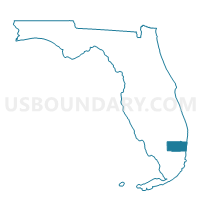
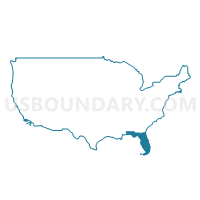
Conservation CCD, Broward County, Florida
About
Outline

Summary
| Unique Area Identifier | 124959 |
| Name | Conservation CCD |
| County | Broward County |
| State | Florida |
| Area (square miles) | 798.50 |
| Land Area (square miles) | 798.13 |
| Water Area (square miles) | 0.36 |
| % of Land Area | 99.95 |
| % of Water Area | 0.05 |
| Latitude of the Internal Point | 26.24794370 |
| Longtitude of the Internal Point | -80.60531770 |
| Total Population | 20 |
| Total Housing Units | 11 |
| Total Households | 11 |
| Median Age | 40.5 |
Maps

Graphs
Select a template below for downloading or customizing gragh for Conservation CCD, Broward County, Florida


Neighbors
Neighoring County Subdivision (by Name) Neighboring County Subdivision on the Map
- Clewiston CCD, Hendry County, FL
- Coral Springs-Margate CCD, Broward County, FL
- Davie CCD, Broward County, FL
- Deerfield Beach CCD, Broward County, FL
- Everglades CCD, Miami-Dade County, FL
- Everglades CCD, Collier County, FL
- Glades CCD, Palm Beach County, FL
- Hialeah CCD, Miami-Dade County, FL
- Immokalee CCD, Collier County, FL
- Miramar-Pembroke Pines CCD, Broward County, FL
- Plantation CCD, Broward County, FL
Top 10 Neighboring Place (by Population) Neighboring Place on the Map
- Pembroke Pines city, FL (154,750)
- Miramar city, FL (122,041)
- Sunrise city, FL (84,439)
- Weston city, FL (65,333)
- Tamarac city, FL (60,427)
- Southwest Ranches town, FL (7,345)
Top 10 Neighboring Unified School District (by Population) Neighboring Unified School District on the Map
- Dade County School District, FL (2,496,435)
- Broward County School District, FL (1,748,066)
- Palm Beach County School District, FL (1,320,134)
- Collier County School District, FL (321,520)
- Hendry County School District, FL (39,140)
Top 10 Neighboring State Legislative District Lower Chamber (by Population) Neighboring State Legislative District Lower Chamber on the Map
- State House District 112, FL (210,556)
- State House District 101, FL (189,600)
- State House District 97, FL (169,848)
- State House District 78, FL (156,153)
- State House District 77, FL (147,455)
- State House District 96, FL (140,377)
- State House District 98, FL (134,942)
Top 10 Neighboring State Legislative District Upper Chamber (by Population) Neighboring State Legislative District Upper Chamber on the Map
- State Senate District 39, FL (483,183)
- State Senate District 34, FL (481,165)
- State Senate District 30, FL (458,703)
- State Senate District 40, FL (448,543)
- State Senate District 32, FL (428,898)
Top 10 Neighboring 111th Congressional District (by Population) Neighboring 111th Congressional District on the Map
- Congressional District 25, FL (807,176)
- Congressional District 19, FL (736,419)
- Congressional District 21, FL (693,501)
- Congressional District 20, FL (691,727)
- Congressional District 23, FL (684,107)
Top 10 Neighboring Census Tract (by Population) Neighboring Census Tract on the Map
- Census Tract 112.02, Collier County, FL (18,805)
- Census Tract 1103.24, Broward County, FL (15,742)
- Census Tract 703.17, Broward County, FL (14,665)
- Census Tract 105.03, Broward County, FL (11,237)
- Census Tract 124, Miami-Dade County, FL (9,525)
- Census Tract 79.12, Palm Beach County, FL (9,228)
- Census Tract 203.18, Broward County, FL (8,850)
- Census Tract 106.01, Broward County, FL (8,236)
- Census Tract 204.09, Broward County, FL (7,483)
- Census Tract 111.02, Collier County, FL (7,291)
Top 10 Neighboring 5-Digit ZIP Code Tabulation Area (by Population) Neighboring 5-Digit ZIP Code Tabulation Area on the Map
- 33065, FL (51,921)
- 33018, FL (46,117)
- 33029, FL (45,235)
- 33321, FL (44,327)
- 33071, FL (36,964)
- 33351, FL (32,890)
- 33326, FL (31,257)
- 33076, FL (29,751)
- 33327, FL (22,658)
- 33440, FL (19,743)
Data
Demographic, Population, Households, and Housing Units
** Data sources from census 2010 **
Show Data on Map
Download Full List as CSV
Download Quick Sheet as CSV
| Subject | This Area | Broward County | Florida | National |
|---|---|---|---|---|
| POPULATION | ||||
| Total Population Map | 20 | 1,748,066 | 18,801,310 | 308,745,538 |
| POPULATION, HISPANIC OR LATINO ORIGIN | ||||
| Not Hispanic or Latino Map | 19 | 1,309,819 | 14,577,504 | 258,267,944 |
| Hispanic or Latino Map | 1 | 438,247 | 4,223,806 | 50,477,594 |
| POPULATION, RACE | ||||
| White alone Map | 16 | 1,102,231 | 14,109,162 | 223,553,265 |
| Black or African American alone Map | 0 | 467,519 | 2,999,862 | 38,929,319 |
| American Indian and Alaska Native alone Map | 1 | 5,065 | 71,458 | 2,932,248 |
| Asian alone Map | 0 | 56,795 | 454,821 | 14,674,252 |
| Native Hawaiian and Other Pacific Islander alone Map | 0 | 911 | 12,286 | 540,013 |
| Some Other Race alone Map | 1 | 64,694 | 681,144 | 19,107,368 |
| Two or More Races Map | 2 | 50,851 | 472,577 | 9,009,073 |
| POPULATION, SEX | ||||
| Male Map | 12 | 846,571 | 9,189,355 | 151,781,326 |
| Female Map | 8 | 901,495 | 9,611,955 | 156,964,212 |
| POPULATION, AGE (18 YEARS) | ||||
| 18 years and over Map | 15 | 1,356,717 | 14,799,219 | 234,564,071 |
| Under 18 years | 5 | 391,349 | 4,002,091 | 74,181,467 |
| POPULATION, AGE | ||||
| Under 5 years | 3 | 103,256 | 1,073,506 | 20,201,362 |
| 5 to 9 years | 2 | 104,071 | 1,080,255 | 20,348,657 |
| 10 to 14 years | 0 | 112,207 | 1,130,847 | 20,677,194 |
| 15 to 17 years | 0 | 71,815 | 717,483 | 12,954,254 |
| 18 and 19 years | 0 | 42,385 | 510,899 | 9,086,089 |
| 20 years | 0 | 20,647 | 258,030 | 4,519,129 |
| 21 years | 0 | 19,850 | 248,602 | 4,354,294 |
| 22 to 24 years | 1 | 64,286 | 722,126 | 12,712,576 |
| 25 to 29 years | 1 | 113,599 | 1,179,227 | 21,101,849 |
| 30 to 34 years | 1 | 110,880 | 1,110,318 | 19,962,099 |
| 35 to 39 years | 2 | 120,146 | 1,178,467 | 20,179,642 |
| 40 to 44 years | 1 | 131,279 | 1,252,787 | 20,890,964 |
| 45 to 49 years | 3 | 143,737 | 1,401,202 | 22,708,591 |
| 50 to 54 years | 0 | 133,303 | 1,340,291 | 22,298,125 |
| 55 to 59 years | 1 | 112,695 | 1,202,418 | 19,664,805 |
| 60 and 61 years | 1 | 39,495 | 458,751 | 7,113,727 |
| 62 to 64 years | 0 | 54,991 | 676,499 | 9,704,197 |
| 65 and 66 years | 1 | 30,778 | 397,917 | 5,319,902 |
| 67 to 69 years | 0 | 40,891 | 561,316 | 7,115,361 |
| 70 to 74 years | 2 | 53,684 | 768,707 | 9,278,166 |
| 75 to 79 years | 1 | 44,374 | 615,514 | 7,317,795 |
| 80 to 84 years | 0 | 38,171 | 482,023 | 5,743,327 |
| 85 years and over | 0 | 41,526 | 434,125 | 5,493,433 |
| MEDIAN AGE BY SEX | ||||
| Both sexes Map | 40.50 | 39.70 | 40.70 | 37.20 |
| Male Map | 37.50 | 38.50 | 39.40 | 35.80 |
| Female Map | 46.50 | 40.70 | 42.10 | 38.50 |
| HOUSEHOLDS | ||||
| Total Households Map | 11 | 686,047 | 7,420,802 | 116,716,292 |
| HOUSEHOLDS, HOUSEHOLD TYPE | ||||
| Family households: Map | 4 | 434,488 | 4,835,475 | 77,538,296 |
| Husband-wife family Map | 2 | 293,617 | 3,457,149 | 56,510,377 |
| Other family: Map | 2 | 140,871 | 1,378,326 | 21,027,919 |
| Male householder, no wife present Map | 2 | 36,028 | 373,284 | 5,777,570 |
| Female householder, no husband present Map | 0 | 104,843 | 1,005,042 | 15,250,349 |
| Nonfamily households: Map | 7 | 251,559 | 2,585,327 | 39,177,996 |
| Householder living alone Map | 7 | 197,539 | 2,021,781 | 31,204,909 |
| Householder not living alone Map | 0 | 54,020 | 563,546 | 7,973,087 |
| HOUSEHOLDS, HISPANIC OR LATINO ORIGIN OF HOUSEHOLDER | ||||
| Not Hispanic or Latino householder: Map | 10 | 542,133 | 6,087,554 | 103,254,926 |
| Hispanic or Latino householder: Map | 1 | 143,914 | 1,333,248 | 13,461,366 |
| HOUSEHOLDS, RACE OF HOUSEHOLDER | ||||
| Householder who is White alone | 9 | 477,897 | 5,918,746 | 89,754,352 |
| Householder who is Black or African American alone | 0 | 152,390 | 1,005,589 | 14,129,983 |
| Householder who is American Indian and Alaska Native alone | 1 | 1,755 | 25,704 | 939,707 |
| Householder who is Asian alone | 0 | 18,368 | 145,808 | 4,632,164 |
| Householder who is Native Hawaiian and Other Pacific Islander alone | 0 | 304 | 3,858 | 143,932 |
| Householder who is Some Other Race alone | 1 | 19,787 | 192,042 | 4,916,427 |
| Householder who is Two or More Races | 0 | 15,546 | 129,055 | 2,199,727 |
| HOUSEHOLDS, HOUSEHOLD TYPE BY HOUSEHOLD SIZE | ||||
| Family households: Map | 4 | 434,488 | 4,835,475 | 77,538,296 |
| 2-person household Map | 1 | 168,039 | 2,183,933 | 31,882,616 |
| 3-person household Map | 2 | 106,316 | 1,086,320 | 17,765,829 |
| 4-person household Map | 0 | 90,600 | 874,904 | 15,214,075 |
| 5-person household Map | 1 | 41,901 | 411,851 | 7,411,997 |
| 6-person household Map | 0 | 16,391 | 165,397 | 3,026,278 |
| 7-or-more-person household Map | 0 | 11,241 | 113,070 | 2,237,501 |
| Nonfamily households: Map | 7 | 251,559 | 2,585,327 | 39,177,996 |
| 1-person household Map | 7 | 197,539 | 2,021,781 | 31,204,909 |
| 2-person household Map | 0 | 46,098 | 459,229 | 6,360,012 |
| 3-person household Map | 0 | 5,248 | 66,366 | 992,156 |
| 4-person household Map | 0 | 1,683 | 25,473 | 411,171 |
| 5-person household Map | 0 | 594 | 7,379 | 126,634 |
| 6-person household Map | 0 | 246 | 2,998 | 48,421 |
| 7-or-more-person household Map | 0 | 151 | 2,101 | 34,693 |
| HOUSING UNITS | ||||
| Total Housing Units Map | 11 | 810,388 | 8,989,580 | 131,704,730 |
| HOUSING UNITS, OCCUPANCY STATUS | ||||
| Occupied Map | 11 | 686,047 | 7,420,802 | 116,716,292 |
| Vacant Map | 0 | 124,341 | 1,568,778 | 14,988,438 |
| HOUSING UNITS, OCCUPIED, TENURE | ||||
| Owned with a mortgage or a loan Map | 0 | 333,521 | 3,348,864 | 52,979,430 |
| Owned free and clear Map | 8 | 123,211 | 1,650,115 | 23,006,644 |
| Renter occupied Map | 3 | 229,315 | 2,421,823 | 40,730,218 |
| HOUSING UNITS, VACANT, VACANCY STATUS | ||||
| For rent Map | 0 | 27,753 | 371,626 | 4,137,567 |
| Rented, not occupied Map | 0 | 1,148 | 15,438 | 206,825 |
| For sale only Map | 0 | 15,687 | 198,232 | 1,896,796 |
| Sold, not occupied Map | 0 | 2,577 | 31,911 | 421,032 |
| For seasonal, recreational, or occasional use Map | 0 | 55,092 | 657,070 | 4,649,298 |
| For migrant workers Map | 0 | 28 | 1,541 | 24,161 |
| Other vacant Map | 0 | 22,056 | 292,960 | 3,652,759 |
| HOUSING UNITS, OCCUPIED, AVERAGE HOUSEHOLD SIZE BY TENURE | ||||
| Total: Map | 1.82 | 2.52 | 2.48 | 2.58 |
| Owner occupied Map | 1.63 | 2.54 | 2.47 | 2.65 |
| Renter occupied Map | 2.33 | 2.48 | 2.49 | 2.44 |
| HOUSING UNITS, OCCUPIED, TENURE BY RACE OF HOUSEHOLDER | ||||
| Owner occupied: Map | 8 | 456,732 | 4,998,979 | 75,986,074 |
| Householder who is White alone Map | 6 | 346,014 | 4,252,583 | 63,446,275 |
| Householder who is Black or African American alone Map | 0 | 78,099 | 480,760 | 6,261,464 |
| Householder who is American Indian and Alaska Native alone Map | 1 | 932 | 14,279 | 509,588 |
| Householder who is Asian alone Map | 0 | 13,175 | 98,804 | 2,688,861 |
| Householder who is Native Hawaiian and Other Pacific Islander alone Map | 0 | 171 | 1,917 | 61,911 |
| Householder who is Some Other Race alone Map | 1 | 9,329 | 81,491 | 1,975,817 |
| Householder who is Two or More Races Map | 0 | 9,012 | 69,145 | 1,042,158 |
| Renter occupied: Map | 3 | 229,315 | 2,421,823 | 40,730,218 |
| Householder who is White alone Map | 3 | 131,883 | 1,666,163 | 26,308,077 |
| Householder who is Black or African American alone Map | 0 | 74,291 | 524,829 | 7,868,519 |
| Householder who is American Indian and Alaska Native alone Map | 0 | 823 | 11,425 | 430,119 |
| Householder who is Asian alone Map | 0 | 5,193 | 47,004 | 1,943,303 |
| Householder who is Native Hawaiian and Other Pacific Islander alone Map | 0 | 133 | 1,941 | 82,021 |
| Householder who is Some Other Race alone Map | 0 | 10,458 | 110,551 | 2,940,610 |
| Householder who is Two or More Races Map | 0 | 6,534 | 59,910 | 1,157,569 |
| HOUSING UNITS, OCCUPIED, TENURE BY HISPANIC OR LATINO ORIGIN OF HOUSEHOLDER | ||||
| Owner occupied: Map | 8 | 456,732 | 4,998,979 | 75,986,074 |
| Not Hispanic or Latino householder Map | 7 | 368,489 | 4,274,313 | 69,617,625 |
| Hispanic or Latino householder Map | 1 | 88,243 | 724,666 | 6,368,449 |
| Renter occupied: Map | 3 | 229,315 | 2,421,823 | 40,730,218 |
| Not Hispanic or Latino householder Map | 3 | 173,644 | 1,813,241 | 33,637,301 |
| Hispanic or Latino householder Map | 0 | 55,671 | 608,582 | 7,092,917 |
| HOUSING UNITS, OCCUPIED, TENURE BY HOUSEHOLD SIZE | ||||
| Owner occupied: Map | 8 | 456,732 | 4,998,979 | 75,986,074 |
| 1-person household Map | 5 | 122,842 | 1,227,080 | 16,453,569 |
| 2-person household Map | 1 | 150,686 | 1,975,675 | 27,618,605 |
| 3-person household Map | 2 | 72,703 | 750,284 | 12,517,563 |
| 4-person household Map | 0 | 64,307 | 605,447 | 10,998,793 |
| 5-person household Map | 0 | 28,267 | 268,036 | 5,057,765 |
| 6-person household Map | 0 | 10,724 | 104,017 | 1,965,796 |
| 7-or-more-person household Map | 0 | 7,203 | 68,440 | 1,373,983 |
| Renter occupied: Map | 3 | 229,315 | 2,421,823 | 40,730,218 |
| 1-person household Map | 2 | 74,697 | 794,701 | 14,751,340 |
| 2-person household Map | 0 | 63,451 | 667,487 | 10,624,023 |
| 3-person household Map | 0 | 38,861 | 402,402 | 6,240,422 |
| 4-person household Map | 0 | 27,976 | 294,930 | 4,626,453 |
| 5-person household Map | 1 | 14,228 | 151,194 | 2,480,866 |
| 6-person household Map | 0 | 5,913 | 64,378 | 1,108,903 |
| 7-or-more-person household Map | 0 | 4,189 | 46,731 | 898,211 |
Loading...